Facts, statistics, data… helpful, but not entertaining. Just telling people facts about your product or a problem that your business solves, won’t make them listen nor remember what you’ve said long enough to become a customer.
This is where an infographic comes in. Infographics and charts present data much better. It’s shorter and more visually pleasing than looking at a long article. It’s also statistically proven to get retained in people’s brains better.
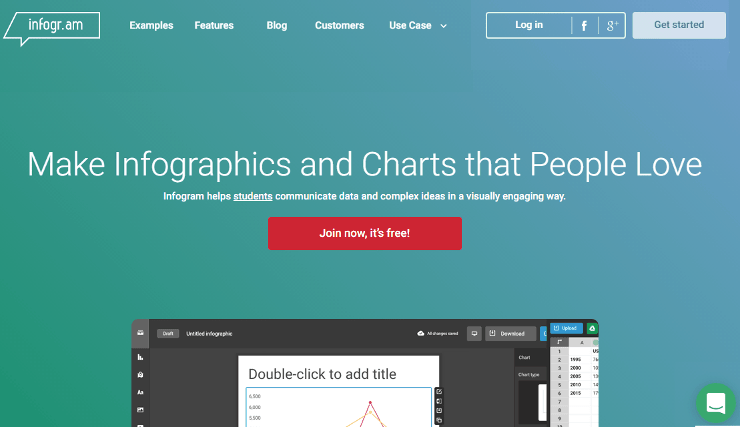
Create your own infographics without spending a lot of money on a graphic artist or waste time finding one. Sign up for a designing platform that helps you do what you need to do on your own.
What You Need
-
Plan with infographic design service.
Setup Steps
Preparation.
-
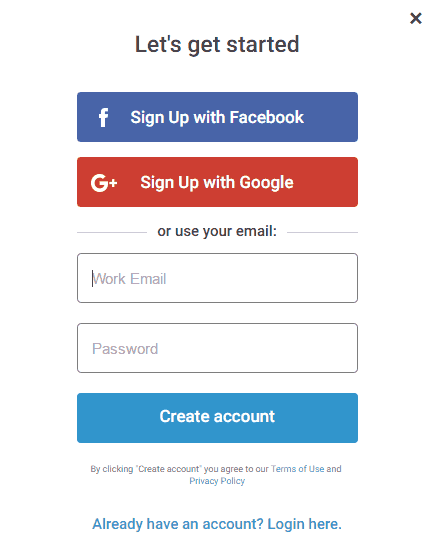
Create your account at https://infogr.am.
Collect your data.
-
Put all of your data into one place for you to upload.
-
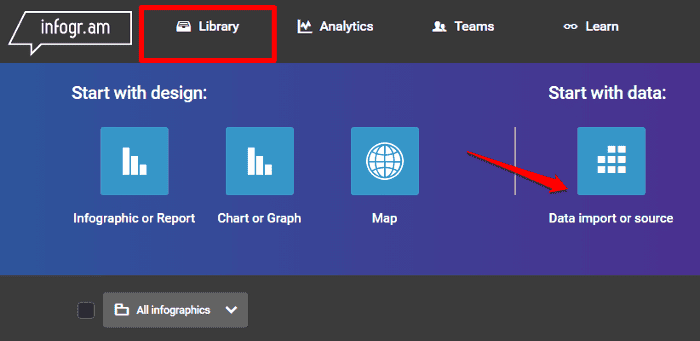
Click Library and click Data import or source.
-
Choose a data source and the file you want to import.
Creation.
-
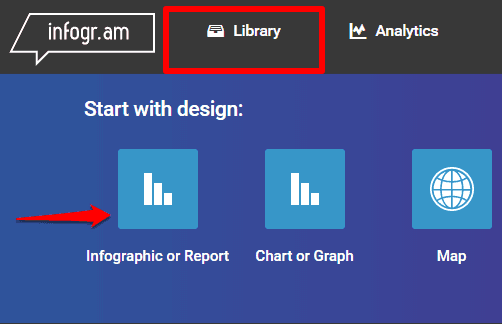
Back at the Library tab, click Infographic or Report.
-
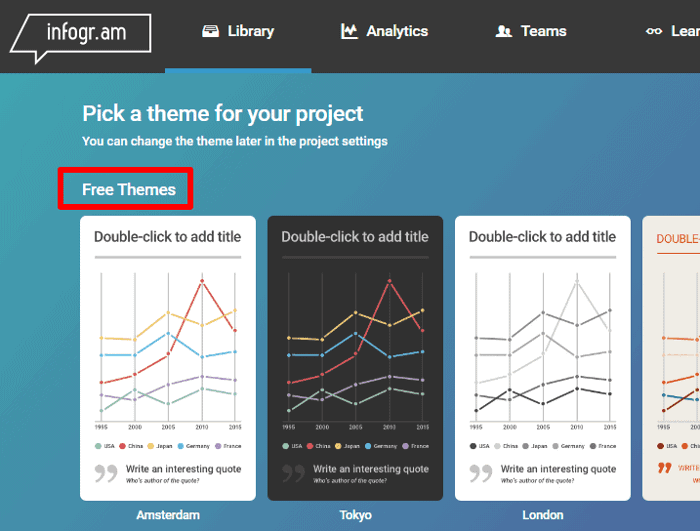
Choose a theme.
-
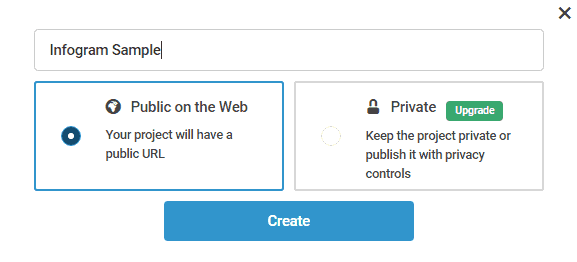
Enter the Infographic title and click Create.
-
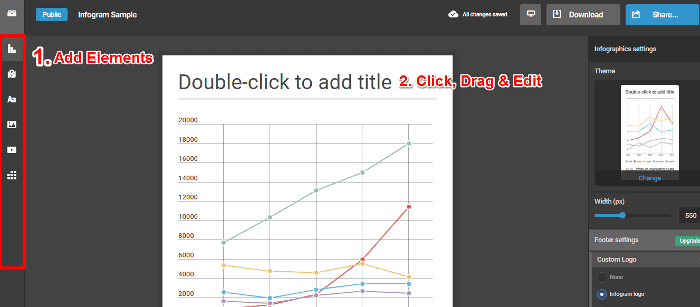
Add a chart, map, text, graphics, and media by clicking on the icons on the left panel.
-
Double click on a text box to edit or add text to them.
-
Drag items around to reorganize.
-
Add more data by clicking the data icon and choosing a source. Click Download or Share when you’re done.
-
Confirm that the data for your infographics are correct and up to date.
Due diligence.
-
Do your research on the content for your infographic.
-
Make a rough draft or outline.
-
Find a service to sign up for. Infogram is one that’s dedicated to infographics.
Timeframe
Time to do: 1 day
Time to see results: 1 month
Additional Tips
Double check your sources and make sure your content is new and correct. Create and build your email list. Optimize your landing page. Find the right influencers on social media and send them a link to your infographic, including the reason why they could be interested in it. Create social media accounts for your business and share your infographics there. Link back to your infographics on Twitter. Use popular hashtags on Instagram and get creative with your posts. Sign up for Pinterest and post them there. Get your content on infographic directories.
Potential Results
An easy designing platform offers you a creative and interactive way to visualize your data for audiences. Because they’re so easy and quick to make, you could make up to 10 infographics a day if you wanted to and have enough time to edit those you’ve already shared and need to be updated. It’s a great way for people to remember you and opt to choose your business when needed.


