Research is an important part of creating content and publishing it. But it’s not just about looking up stuff for your article, it’s also about metrics on how you’re doing, how your competition is doing, how your audience is doing.
No matter how good you think the articles of your authors are, you won’t generate the traffic that you want if it’s not what your readers want. So analyze your content and get the right reports so you’ll know which angles, topics, and content are working for your site, and which ones are not.
Sign up for sites that give you the knowledge to help you make the right decisions. Your site’s traffic is going to overwhelm you. In a good way.
What You Need
-
Plan with site metrics platform
Setup Steps
Find the site for you.
-
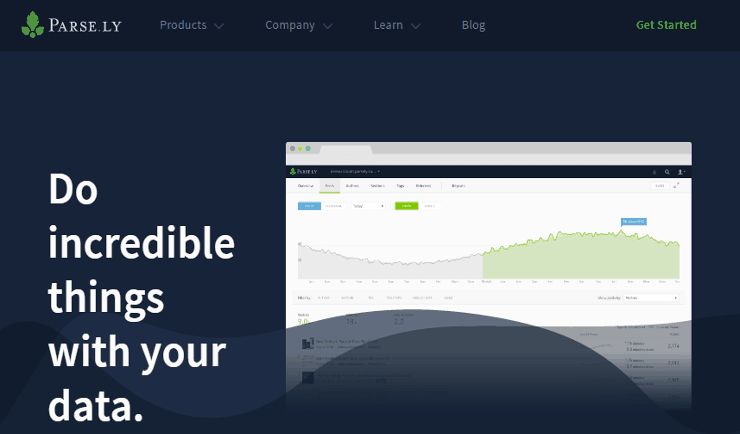
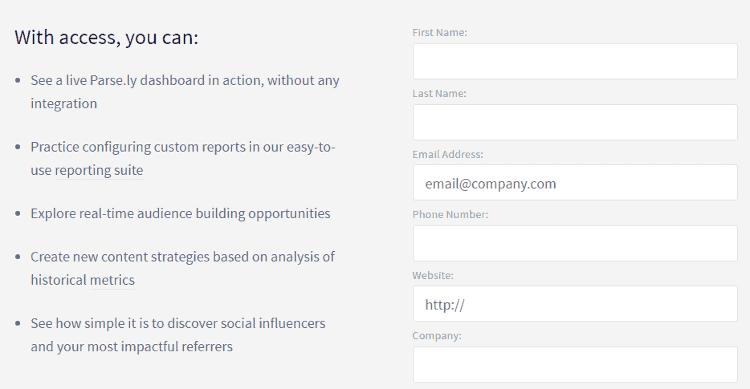
Get an account at https://www.parsely.com.
-
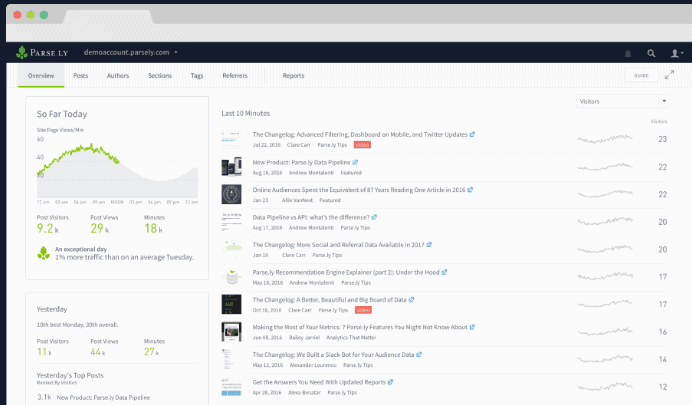
At the dashboard, Click the drop down to select the metrics you want to see.
-
A real time report on how you’re doing for the day can be seen on the top left with yesterday’s stats found on the bottom for quick comparison.
-
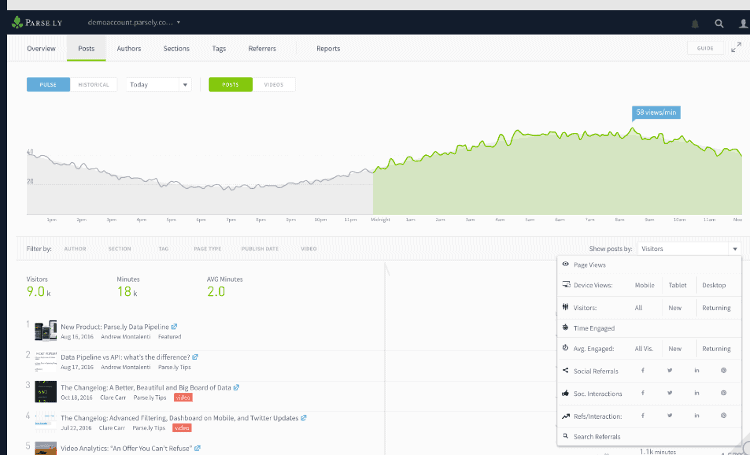
Click Posts on the left tab and get detailed metrics on your specific posts. See what your audience looks like and compare it to the other posts that you have.
-
Tailor your future posts according to what your readers visit your site for; seen still on the Posts tab.
-
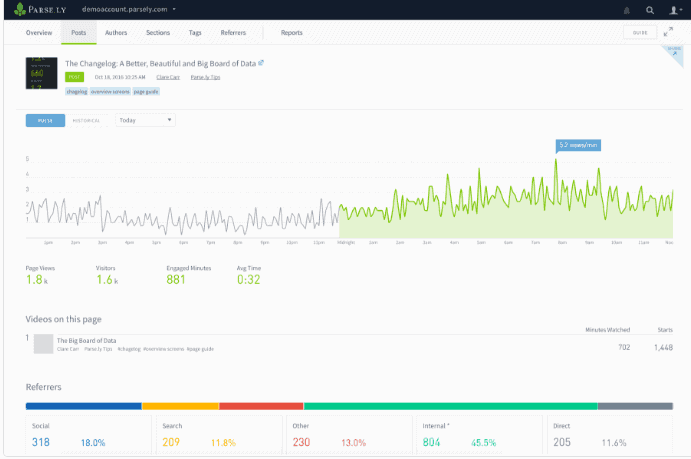
Find out how your authors are doing on the Authors tab.
-
See which authors your readers follow and what type of articles they write about.
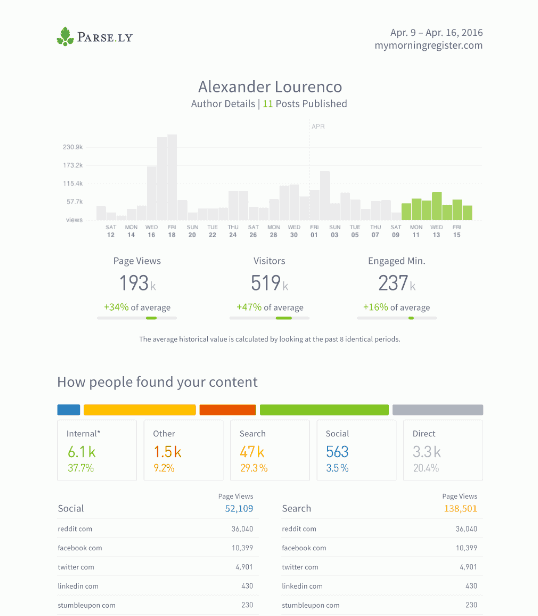
Go to Reports and choose a type or report you want to see, create, and share with your team.
-
Top Reports – list of top posts, authors, sections, or tags; including those available in your subscription tier
-
Site Stats Over Time – views, visitors, and averages broken down by day, week, month, or year
-
Weekly Digest – template report that can be run for an individual author, section or tag for content published over the last week
-
Performance Reports – template report that shows audience, referral, and social interaction data for a certain period
-
Click through the prompts and get a clean report highlighting the sections and details you want.
-
Export reports by clicking Spreadsheet or CSV beside EXPORT on top of the Post and Author analysis.
Timeframe
Time to do: 1 hour
Time to see results: 1 month
Additional Tips
Create and build your email list. Send new content regularly to your list. Create and connect your social media accounts. Share your blogs on your accounts regularly. Pitch your best performing blogs to others. Consider guest posting. Review the stats you get and tailor your new posts accordingly. Do blogger outreach emails. Submit your posts to a content community like Inbound.org, Growth Hackers, and Hacker News. Create buttons for people to easily share your content. Focus on your posts that get the best results.
Potential Results
Data analysis can sound tedious and boring. But using the right service makes it so easy that it becomes enjoyable. Understand how the platform works and understand the insights you’re being provided with and how you can make it work to your advantage. By making changes based on the provided reports, you can increase your page views, site visits, readers, and conversions. You could make anything from $800 to $1,500 per month in the next couple of months with better content moved by great data.


